Maritime Chokepoints
A visual exploration of the threats hanging over the world's most critical maritime passages—and the trade at stake.


Maritime transport is the backbone of global trade, carrying about 80% of traded volumes and 50% of traded value worldwide. A large share of this trade passes through just 24 major maritime chokepoints—narrow canals and straits where shipping routes concentrate.
Through only these few straits and canals, a large share of total global trade volumes flows. Each circle shows how much of the world's trade by value passes through that chokepoint.
For example, the Taiwan Strait and the nearby Malacca Strait each have more than a fifth of global trade passing through them.
Other key passages on the east–west trade axis are the Suez Canal and the Strait of Gibraltar, through which around 16% and 18% of global trade flows. But what happens when one of these passages is blocked?
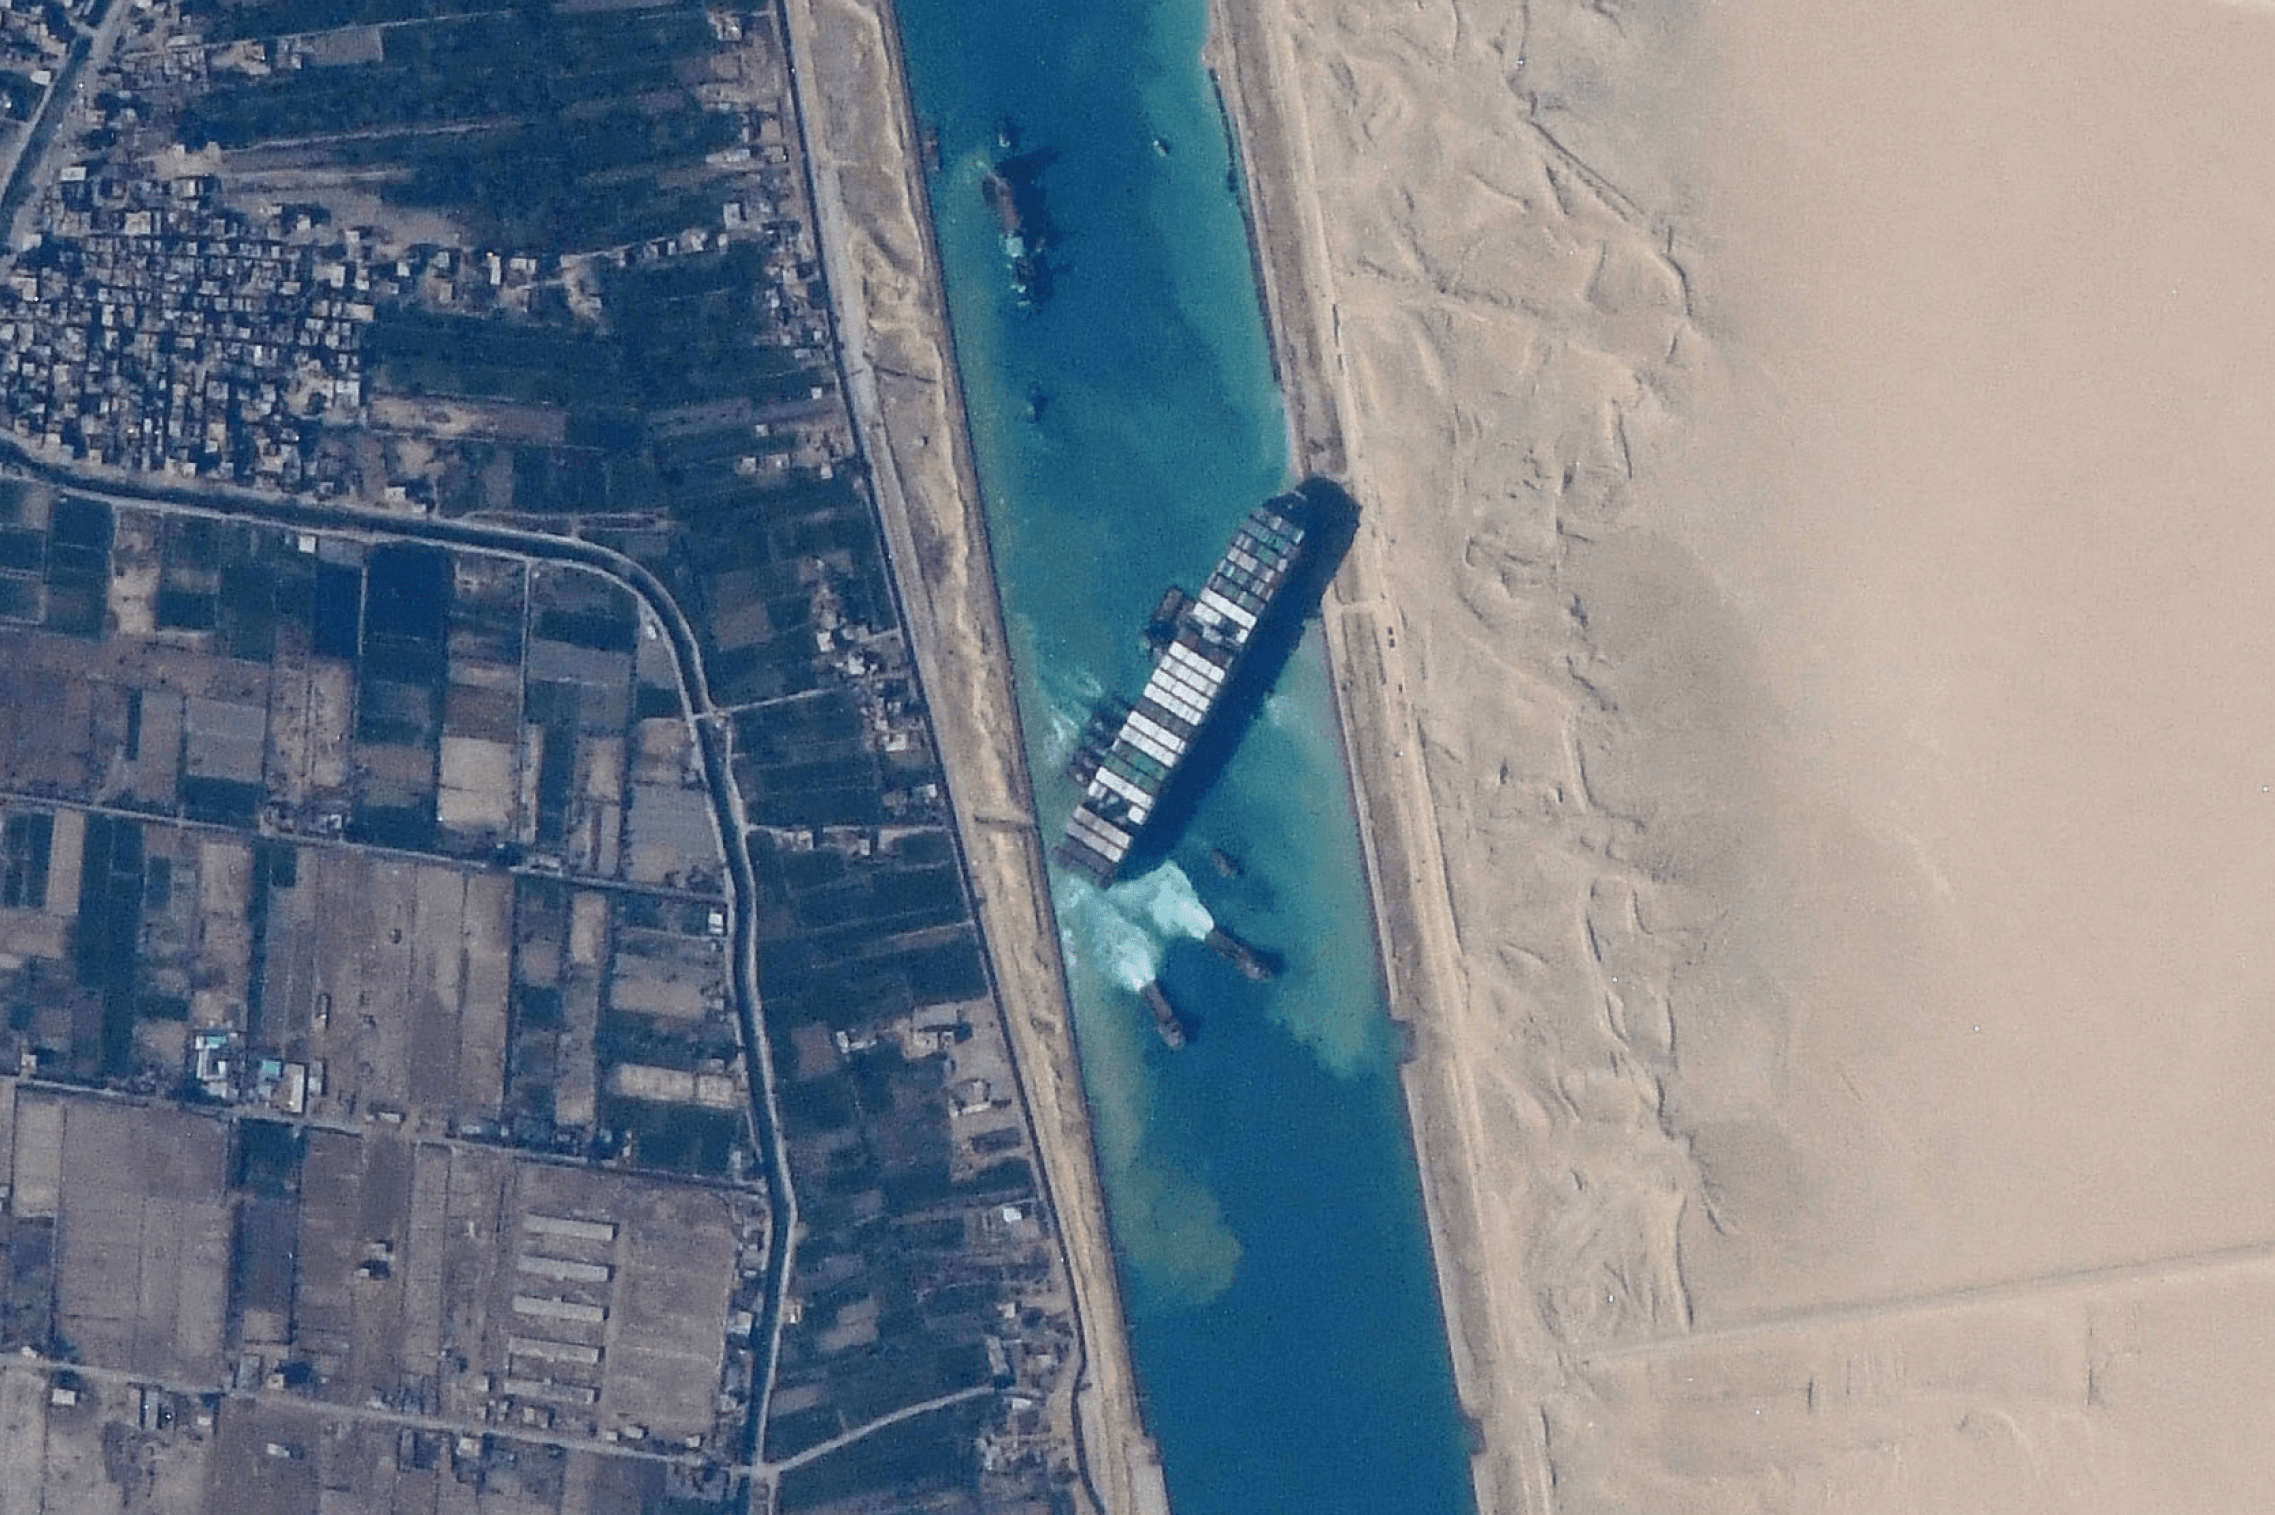
The answer to this question became reality between March 23 and 29, 2021, when the container ship Ever Given became stuck in the Suez Canal, tying up goods worth an estimated US$9.6 billion per day.
But how much trade is at risk each year from disruptions like these? Researchers Verschuur, Lumma, and Hall set out to answer this question by modelling the expected value of trade disrupted by eight different hazards across 24 maritime chokepoints worldwide.
In the case of the Suez Canal, the authors of the study estimated that trade at risk from blockages amounts to about US$1.6 billion per year. Yet blockages are far from being the risk that threatens the largest share of trade value at this chokepoint.
In fact, the Suez Canal faces its greatest threat from geopolitical conflict. An estimated US$82.20 billion in trade value per year is exposed to geopolitical tensions in this single corridor.
In the study, trade is considered “disrupted” when it is affected by a chokepoint disruption, such as delays, rerouting, or partial blockages. Each disruption is weighted by how likely it is to occur in a year, how long it is expected to last, and how severe its impact is on shipping flows (See more in Data Source.)
As a result, the full threat picture at the Suez Canal looks as follows: In addition to blockages and geopolitical risks, terrorist attacks, piracy, and conflicts involving non-state armed actors are potential risks that could disrupt shipping at the Suez Canal. Together, these hazards amount to US$88.33 billion in trade at risk every year or 2.39% of the canal’s total trade throughput.
There is only one chokepoint that faces an even higher relative risk: Bab el-Mandeb, a narrow strait connecting the Red Sea and the Gulf of Aden, Yemen. Here, about 3.14% of total throughput is considered to be at risk. Like at the Suez Canal, geopolitical tensions are the greatest threat.
However, this chokepoint is exposed to higher risks from terrorist attacks, piracy, and armed conflicts involving non-state actors. Recent Houthi interventions linked to the war in Gaza illustrate how vulnerable this corridor is to disruption.
Main hazards vary from region to region. Although the Taiwan Strait is also exposed to significant geopolitical risk driven by China–U.S. tensions, at these latitudes an even greater threat comes into play.
Tropical cyclones pose a major threat not only to the Taiwan Strait but to many chokepoints across the region.
On the other side of the world, the Panama Canal stands out as the only chokepoint simultaneously threatened by earthquakes and droughts. Severe drought in 2023 – 2024 forced unprecedented transit restrictions, cutting daily crossings significantly.
It is also the only chokepoint exposed to all eight risk categories examined in the study: tropical cyclones, piracy, terrorist attacks, conflicts involving non-state armed actors, earthquakes, blockages, drought, and geopolitical conflicts.
Dive into the full dataset: Compare chokepoints, filter by hazard type, and identify which disruptions would have the greatest system-wide impact—based on whether affected chokepoints have no rerouting options (), require detours of more than 5,000 km (), or less than 5,000 km ().
Explore trade at risk by chokepoint
For each chokepoint, the colored area shows the estimated annual trade at risk. Hover over a chokepoint to see its location on the world map.
Filter by hazards
Rerouting Options
Scale mode
Sort by
Bab el-Mandeb Strait
$116.69B trade at risk
Suez Canal
$88.33B trade at risk
Taiwan Strait
$74.65B trade at risk
Malacca Strait
$25.55B trade at risk
Panama Canal
$22.08B trade at risk
Korea Strait
$16.49B trade at risk
Luzon Strait
$9.95B trade at risk
Bosporus Strait
$8.28B trade at risk
Windward Passage
$6.52B trade at risk
Strait of Hormuz
$3.73B trade at risk
Tsugaru Strait
$2.34B trade at risk
Yucatan Channel
$1.99B trade at risk
Gibraltar Strait
$1.65B trade at risk
Bohai Strait
$1.55B trade at risk
Mona Passage
$1.23B trade at risk
Dover Strait
$1.00B trade at risk
Sunda Strait
$0.47B trade at risk
Lombok Strait
$0.24B trade at risk
Torres Strait
$0.11B trade at risk
Ombai Strait
$0.06B trade at risk
Makassar Strait
$0.02B trade at risk
Cape of Good Hope
$0.00B trade at risk